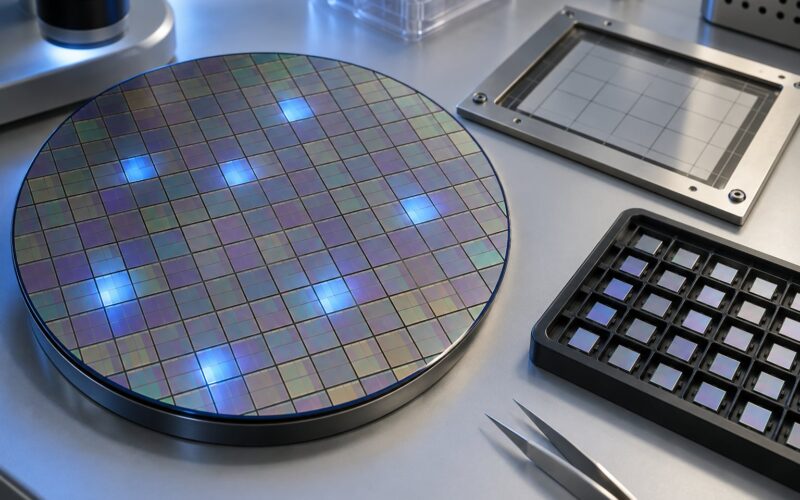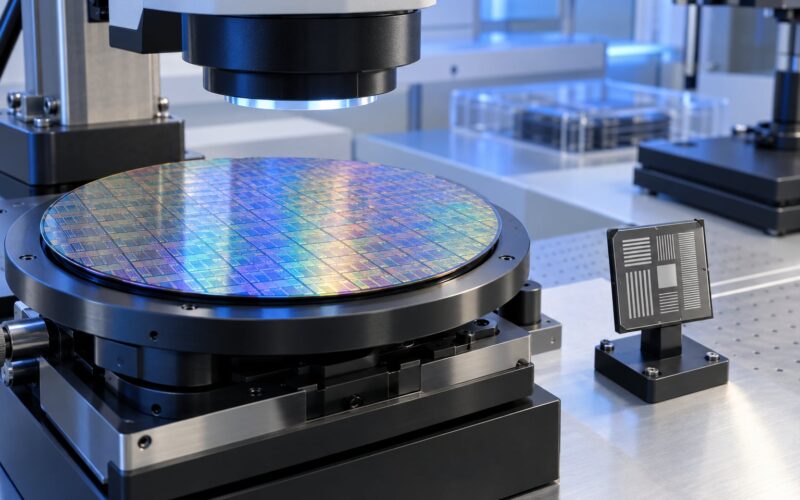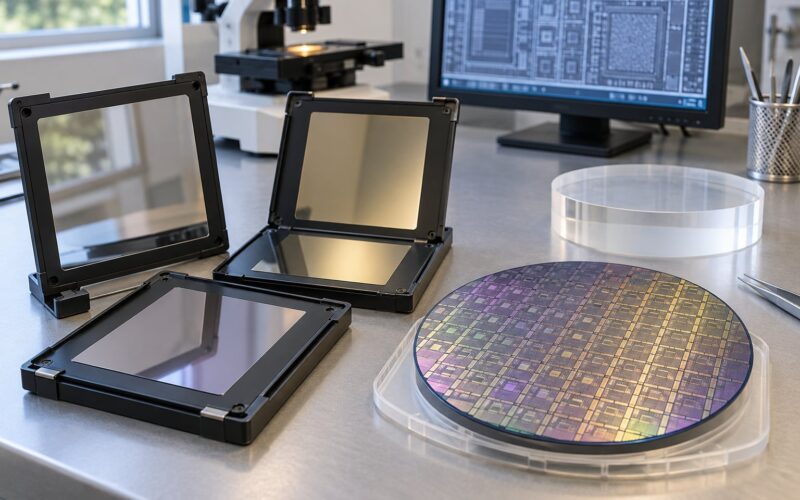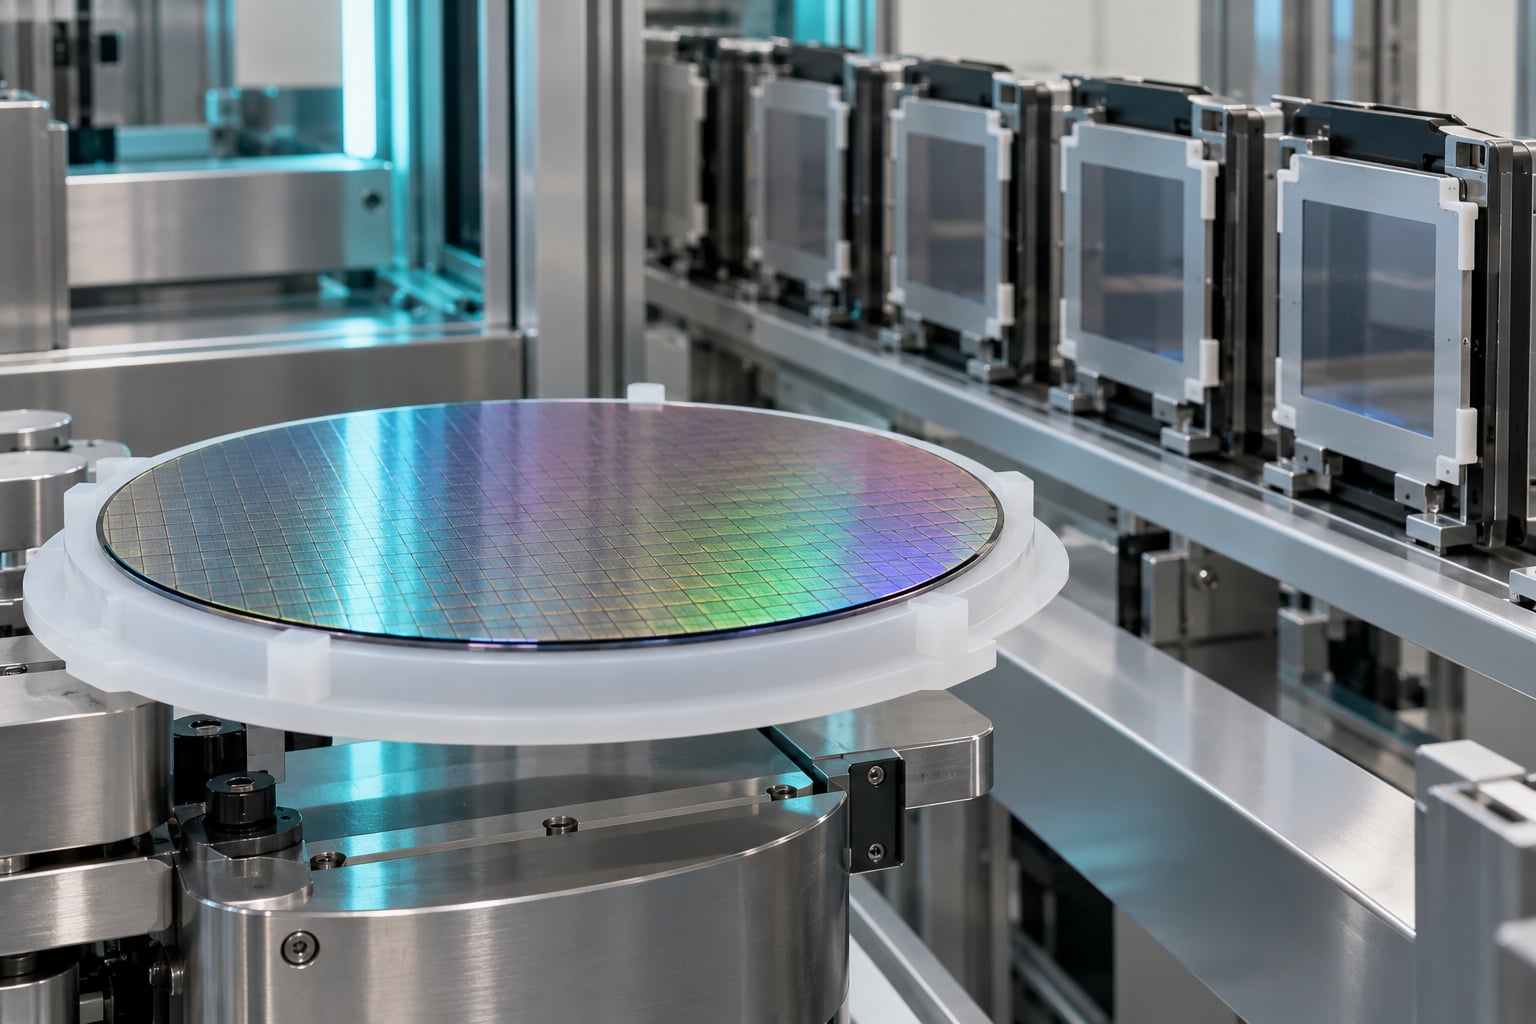
A wafer starts per month number, usually shortened to WSPM, is the count of silicon wafers a chip fab is designed to begin processing in a month. It measures the front-end capacity a facility is built and equipped for, not the chips that come out the other end.
To make sense of that, you need the anchor event. A wafer start is a single wafer entering the fabrication process and being committed to the full flow of process steps. Counting starts means counting the moment a wafer is loaded into that flow, not the moment it leaves it. “Fab” is just the common shorthand for a wafer fabrication plant, the cleanroom facility where that flow happens. TSMC’s fabs in Taiwan, its Arizona site, Samsung’s and Intel’s all express capacity in the same unit, which is precisely why the unit is worth understanding.
Here is the short version before the detail:
- WSPM counts wafers entering the process flow in a month, so it describes throughput intent, not shipments.
- A start happens once per wafer, at the front of the line, long before a single die has been cut from it.
- The number is a nameplate ceiling. Actual output runs below it because of downtime, maintenance, utilization and yield ramp.
- WSPM is not a die count, a revenue figure or a utilization rate, even though headlines sometimes read as if it were.
Table of Contents
- What Is a Wafer Starts per Month Number?
- What a wafer start actually is
- What a WSPM count deliberately leaves out
- How Is WSPM Calculated?
- A worked monthly example
- The reporting choices that change the number
- Why Do Chip Fabs Track Wafer Starts per Month?
- WSPM, Capacity, and Utilization: What Is the Difference?
- WSPM, WPM, KWPM and the rest of the glossary
- What Does WSPM Say About a Semiconductor Company?
- Why 200mm capacity is restated as 300mm-equivalent
- Why the same number means different things at different nodes
- Real-world reference points
- Where Do You Find WSPM Numbers?
- Why companies say “up to X wafer starts per month”
- What a Wafer Starts per Month Number Does Not Tell You
- Frequently Asked Questions
- Is a wafer start the same as a finished wafer?
- How many wafers does a wafer fabricator start each month?
- Does higher WSPM always mean a semiconductor company is doing better?
- What is the difference between wafer starts and wafer capacity?
- Can WSPM figures from different semiconductor companies be compared?
- Does WSPM measure wafer size, die size, or semiconductor node?
- Key Takeaways
What Is a Wafer Starts per Month Number?
What a wafer starts per month number means in practice: it is the standard unit for stating how much front-end capacity a semiconductor fab is designed to handle each month. Read it as “the number of wafers this line is engineered to begin processing in thirty days.”
What a wafer start actually is
A wafer start is one wafer committed to the full manufacturing flow. Once a wafer is loaded and released into the process, it has been started, and that event is counted exactly one time.
That sounds trivial, and it is. The reason the unit carries so much weight is that it is the earliest measurable point in a long, expensive sequence. From that single start, a wafer will pass through hundreds of deposition, etch, clean and lithography steps before any die is tested.
The number of layers and exposures a wafer receives varies by process node and by the product recipe running on the line. So a fab configured for one product mix measures quite different WSPM from the same fab reconfigured for another. This is one of the first things to keep in mind: the unit is a capacity unit, not a product-independent constant.
What a WSPM count deliberately leaves out
A WSPM figure is not a count of every wafer that ever touches the building. The number excludes the work that never becomes a committed production lot, and it ignores everything about what happens after the front end.
- Engineering and qualification lots – wafers used to develop a recipe, qualify a tool or run a qualification run rather than to ship product.
- Aborted or scrapped lots – wafers dropped before or during the flow. A start still happened, but no finished wafer resulted.
- Wafers already in process – a fab running at steady state carries several weeks of work in the pipeline, and none of it counts as a start in the current month.
- Back-end capacity – packaging, assembly and test are separate facilities or separate parts of the site, and they are quoted in their own units.
That last point matters more than it looks. A fab can be full of wafers and still have empty assembly lines, or have packaging to spare and idle front-end tools. WSPM only ever describes one half of the chain.
How Is WSPM Calculated?
WSPM is calculated bottom-up from the throughput of the bottleneck tools, not counted retrospectively from shipping records. The engineering version of the formula is: scanner throughput in wafers per hour, multiplied by the number of scanners, multiplied by available hours, multiplied by the utilization factor, divided by the number of exposures each wafer needs.
Wafers per hour, usually written WPH, is the single most important hidden variable in every WSPM number, because each wafer has to pass through the lithography step once per layer.
A worked monthly example
Take a simplified single-line scenario. The numbers below are illustrative of the method, not a specific facility.
| Input | Value | Note |
|---|---|---|
| Scanner throughput | 80 wafers per hour | Per tool, per layer |
| Scanners in the lithography area | 4 | Matched, same generation |
| Available hours per month | 720 | 24 hours a day, 30 days |
| Utilization factor | 80% | Allows for downtime and maintenance |
| Exposures per wafer | 3 layers | Recipe dependent |
| Wafer passes per month | 184,320 | 80 x 4 x 720 x 0.80 |
| Implied wafer starts per month | About 15,400 | 184,320 divided by 3 |
Run the same line with a heavier recipe that needs nine exposures instead of three and the same physical tools support roughly 5,100 starts. Nothing about the building, the tools or the staff changed. Only the recipe did. That is the practical reason two fabs with identical nameplate WSPM can be wildly different in terms of how much real silicon they produce per month.
The reporting choices that change the number
Two fabs can both publish an honest WSPM figure and still not be talking about the same thing, because several conventions are not standardized.
- Gross versus net starts. Some figures count every wafer loaded into the flow. Others subtract engineering and qualification lots. The gap between the two is normally a few percent and occasionally much more.
- The averaging period. A monthly figure, a quarterly average, and a figure quoted at full ramp are three different numbers even when the fab is the same. Watch for whether the source says “at full capacity” or “at current run rate”.
- Single fab versus cluster. A corporate total can aggregate a site, several sites, or a campus being built in phases. The Semi-Literate analysis of the global buildout counted fabs at 100,000 or more wafer starts per month as a size threshold, and that 100,000 figure referred to a category of individual facility rather than a company average.
- Partial and engineering wafers. Test wafers and qualification wafers are sometimes inside the number and sometimes outside it, and the disclosure that settles it is often buried.
Why Do Chip Fabs Track Wafer Starts per Month?
Fabs and the governments that subsidize them track wafer starts per month for a reason that has little to do with day-to-day operations: it is a capital-investment and policy unit. It converts an enormous building project into a number that can be compared, costed, subsidized and tracked over time.
The most established heuristic in the industry is cost per 10,000 WSPM, a way of normalizing build cost so that a 28nm line and a finFET line can be talked about in the same sentence. Semiconductor Engineering reported the 28nm figure in 2015 when it covered where 7nm and 5nm were headed, and the framing has stayed useful because the underlying logic did not change. The number tells you how expensive it is to add a fixed slice of front-end capacity.
Subsidy documents use the unit too. A CHIPS Act award, a permitting filing or a state environmental review will state a capacity figure in WSPM because that is what the engineering reports were written in, and because a projected capacity number is exactly the kind of claim a regulator can check against later output.
Inside the fab, WSPM serves a different purpose. Process integration and capacity planning teams track starts as a loading measure: how full the line is relative to what it can carry, and how much room is left for a new product. That is a genuine operational metric, but it is a different question from the strategic one, and mixing the two is a common source of confusion.
WSPM, Capacity, and Utilization: What Is the Difference?
The difference between WSPM, capacity and utilization is where most misreadings live, and it comes down to how many physical constraints each figure has already absorbed.
| Measure | What it says | What moves it |
|---|---|---|
| Nameplate WSPM | The design throughput of the line in a steady month | Tool count, tool speed, recipe |
| Installed capacity | Nameplate adjusted for tools installed and qualified so far | Build phase, tool delivery |
| Qualified capacity | What has actually demonstrated repeatable yield | Process qualification, customer qual |
| Utilization | The share of capacity actually loaded | Demand, product mix, tool uptime |
| Wafers out | Wafers that completed the front-end flow | Starts, cycle time, yield |
| Good die per month | Known-good dies shipped | Die size, yield, test coverage |
Nameplate WSPM is the ceiling. Utilization is the dial that turns it down. Because a fab can never run at 100 percent – maintenance, changeover, unplanned downtime and demand gaps all subtract – real shipments sit below the nameplate figure. An analyst who reports nameplate WSPM as though it were output is making the single most common error in this area.
WSPM, WPM, KWPM and the rest of the glossary
Adjacent reporting uses several similar-looking units, and mixing them up is easy.
| Unit | What it counts | Where you see it |
|---|---|---|
| WSPM | Wafers beginning the fabrication process in a month | Capacity announcements, permitting, policy |
| KWPM | Thousands of wafer starts per month, or in some models thousands of yielded wafers per month | Industry models, older academic literature |
| WPM | Wafers per month, usually an output figure rather than a starts figure | Production reporting, analyst models |
| Good die per month | Known-good dies, after yield and test | Supply and market sizing |
| Gross starts | Every wafer loaded into the flow, including non-production lots | Internal fab metrics |
| Net starts | Starts excluding engineering and qualification lots | Refined capacity comparisons |
| 300mm-equivalent | A normalization convention that restates 200mm capacity on a 300mm basis | Regional and national capacity totals |
Note the KWPM ambiguity. One industry model described the capacity of a specific fab as being measured in wafer-starts-per-month, expressed as thousands of yielded wafers produced every month, which mixes a starts concept with a yield concept in a single unit. Treat any KWPM figure as needing its definition checked before use.
What Does WSPM Say About a Semiconductor Company?
A WSPM figure tells you the scale of a company’s front-end manufacturing footprint, and almost nothing else on its own. Reading it well means normalizing for wafer diameter first and then holding the process node in mind, because those two adjustments can change the meaning by an order of magnitude.
Why 200mm capacity is restated as 300mm-equivalent
A 200mm wafer has roughly half the surface area of a 300mm wafer. The usable area scales with the square of the diameter, so 300mm offers about 2.25 times the area, and with it about 2.25 times the dies for the same die size. Analysts therefore convert smaller-wafer capacity into “300mm-equivalent” so that legacy fabs and leading-edge fabs can be added into one regional or national total.
| Wafer diameter | Approximate area | Relative to 300mm | Approximate die per wafer, small die |
|---|---|---|---|
| 200mm (8 inch) | 31,416 sq mm | 0.44x | 250 to 350 |
| 300mm (12 inch) | 70,686 sq mm | 1.00x | 600 to 800 |
| 450mm, in development | 159,043 sq mm | 2.25x | Not in volume production |
Apply the conversion to a real-style case. A specialty fab quoting 20,000 wafer starts per month on 200mm wafers converts to roughly 8,900 300mm-equivalent starts, because 20,000 multiplied by 0.44 lands just under 9,000. It is a normalization convention for comparison, not a physical equivalence: the 200mm line is not producing smaller 300mm wafers, it is a different line with different economics, and the conversion is an accounting device applied to make totals add up.
Why the same number means different things at different nodes
At a mature node, a fab can run a simpler flow with fewer critical layers, which is part of why 28nm and above capacity remains in structural demand for automotive, industrial and consumer parts. At a leading-edge node, the same physical tools must support many more layers, and extreme ultraviolet lithography narrows the usable field on the wafer, so dies per wafer fall and cost per die rises.
The practical consequence: 50,000 wafer starts per month at a mature node can represent far more total silicon area and far more shipped die than 50,000 at a leading-edge node. When you see a capacity figure, the node is not a footnote. It is half the meaning.
Real-world reference points
Reference points help you size a number quickly. A small specialty fab sits in the low thousands of wafer starts per month. Mid-sized mature-node fabs run into the tens of thousands. Individual leading-edge fabs designed for advanced logic and high bandwidth memory reach the six figures, which is why a 100,000-wafer-starts-per-month threshold is used as a meaningful marker of a large fab. The largest facilities are usually discussed as a campus total rather than a single building.
Per-wafer output is bounded by geometry rather than ambition. A 300mm wafer holds on the order of several hundred small dies, fewer large ones, and never a fixed count, because die size and edge exclusion decide it. That is why any article trying to turn a WSPM headline into a chip count has made a mistake somewhere.
Where Do You Find WSPM Numbers?
WSPM numbers come from a short list of source types, and they are not equally reliable. Knowing which one you are reading tells you what caveats to attach.
| Source | What you get | What to check first |
|---|---|---|
| Company reports and earnings calls | The company’s own framing of capacity and ramp | Is it nameplate, qualified or current run rate |
| Government subsidy and CHIPS documents | Planned capacity tied to a funded project | Is it a target for a future state, and by when |
| SEMI industry capacity trackers | Aggregated capacity by region, diameter and node | The definition behind any 300mm-equivalent restatement |
| Permitting and environmental filings | Facility scale, often the earliest public number | Whether it covers one phase or the whole campus |
| Trade press and analyst reports | Estimates where no company figure exists | Whether the method is disclosed or simply asserted |
| Scanner counts and facility load | Inferred capacity when nothing is published | Exposure layers and utilization assumptions |
The last row is worth a moment. Analysts who estimate capacity without company disclosure work backwards from lithography scanners, their wafers-per-hour ratings, the number of exposures the node requires, and an assumed utilization factor. One published capacity model converted scanner throughput into monthly capacity using layer counts and a utilization factor of about 80 percent, and cross-checked the result against revenue attribution and facility power draw. That approach is useful and inherently approximate; treat its output as an estimate with a stated method, not as a disclosure.
Why companies say “up to X wafer starts per month”
The qualifier is doing a lot of work. “Up to” almost always describes capacity that is planned rather than running, and usually carries three unstated conditions.
- Phased build. The number may describe the completed campus, while only the first phase is built or funded.
- Un-ramped. Nameplate is a design target, and SEMI has long noted that the time to ramp from a token run rate to full capacity runs roughly nine to twelve months for a large fab.
- Not yet qualified. Process qualification and customer qualification both take time after the tools are installed, and volume revenue follows later still.
A number that has been announced but not yet demonstrated is a plan. Treating it as production is the most common error in fab news coverage.
What a Wafer Starts per Month Number Does Not Tell You
Here is the list I would hand to anyone who reads a capacity headline for the first time. Each item is something the number looks like it should tell you and does not.
- Die count. WSPM counts wafers, not dies. Dividing a WSPM figure by anything to get a chip count ignores die size entirely.
- Die size. Two fabs at the same node running the same wafers can ship very different die counts if one is building small sensors and the other is building large accelerators.
- Wafer diameter. A 200mm figure and a 300mm figure are not directly comparable. Check whether the source has already normalized to 300mm-equivalent.
- Layer count and exposure count. The same tools support far fewer starts when each wafer needs more lithography layers.
- Process node. Node determines tool requirements, cost, yield behaviour and die size, so it changes what a start is worth.
- Yield. Starts say nothing about how many dies come off the wafer as good.
- Product mix. Analog and power, logic, DRAM, NAND and high bandwidth memory all consume capacity differently.
- Timing. A capacity announcement is a future state. The ramp curve runs behind it.
- Work already in the pipeline. A fab can report steady starts while the number of wafers in process swings up or down.
- Revenue or profit. WSPM is a physical unit. Whether that capacity is worth anything depends on what is sold into it and at what average selling price.
Used properly, WSPM is a clean, honest, standardized measure of manufacturing scale. Used loosely, it gets stretched into claims about output, technology leadership and commercial success that the number cannot support.
Frequently Asked Questions
Is a wafer start the same as a finished wafer?
No. A wafer start is the moment a wafer enters the front-end process flow and is committed to the full sequence of steps. A finished wafer is one that completed that flow, was tested and was released. Because a fab takes weeks to move a wafer through, and because some lots are aborted, starts and finished wafers never match in any given month.
How many wafers does a wafer fabricator start each month?
It depends entirely on the facility. Small specialty fabs start in the low thousands of wafer starts per month, mid-sized mature-node fabs reach the tens of thousands, and individual advanced fabs are designed for six figures. The number is set by tool count, tool speed, available hours, the utilization factor and how many lithography layers each wafer needs.
Does higher WSPM always mean a semiconductor company is doing better?
No. Wafer starts per month measures physical capacity, not commercial performance. A larger WSPM figure at a mature node with low utilization can be worth less than a smaller figure running near full at a leading-edge node. You need utilization, node, product mix and realized pricing alongside WSPM before drawing any conclusion about how a company is doing.
What is the difference between wafer starts and wafer capacity?
Wafer starts is an activity count: wafers that actually entered the process flow in a month. Capacity is the ceiling the line is designed to handle, often expressed as nameplate wafer starts per month. The two numbers are quoted in the same unit, which is why they get confused, but one describes what happened and the other describes what the building is engineered for.
Can WSPM figures from different semiconductor companies be compared?
Only after normalizing three things: wafer diameter, process node and reporting basis. Convert 200mm capacity to 300mm-equivalent, check whether each figure is nameplate, qualified or actual, and confirm whether engineering and qualification lots are included. The Semi-Literate analysis showed why: it compared regions by counting fabs above a 100,000 WSPM threshold, a metric that only works if the definitions match.
Does WSPM measure wafer size, die size, or semiconductor node?
None of them. WSPM is a count of wafers over time, so it tells you nothing about diameter, die dimensions or process node. A 200mm mature-node fab and a 300mm leading-edge fab can each report the same WSPM while producing completely different amounts of silicon. Diameter has to be handled through a 300mm-equivalent conversion, and node has to be read from the source text.
Key Takeaways
Wafer starts per month, or WSPM, is the count of wafers a fab is designed to begin processing in a month. It is a statement about front-end capacity at the earliest point in the flow, which is exactly why it is so widely used and so widely misread.
Before you take a WSPM figure at face value, check five things: the period it covers, whether it is a single fab or a campus, the wafer diameter and whether it has been converted to 300mm-equivalent, the process node, and whether the number describes starts, nameplate capacity, qualified capacity or actual output. Get those five right and most of the confusion in a fab headline disappears.